Measuring Progress
The American Talent Initiative (ATI) was formed in December 2016 with a goal to attract, enroll, and graduate thousands of additional lower-income students at the 355 colleges and universities that consistently graduate at least 70 percent of their students in six years. ATI members are a subset of these 355 high-graduation-rate institutions.
We have traditionally measured the aggregate progress of ATI members, using Pell enrollment data collected on an annual basis from ATI members, and non-member eligible institutions via IPEDS (for more information, visit the "What We Do" page of our website).
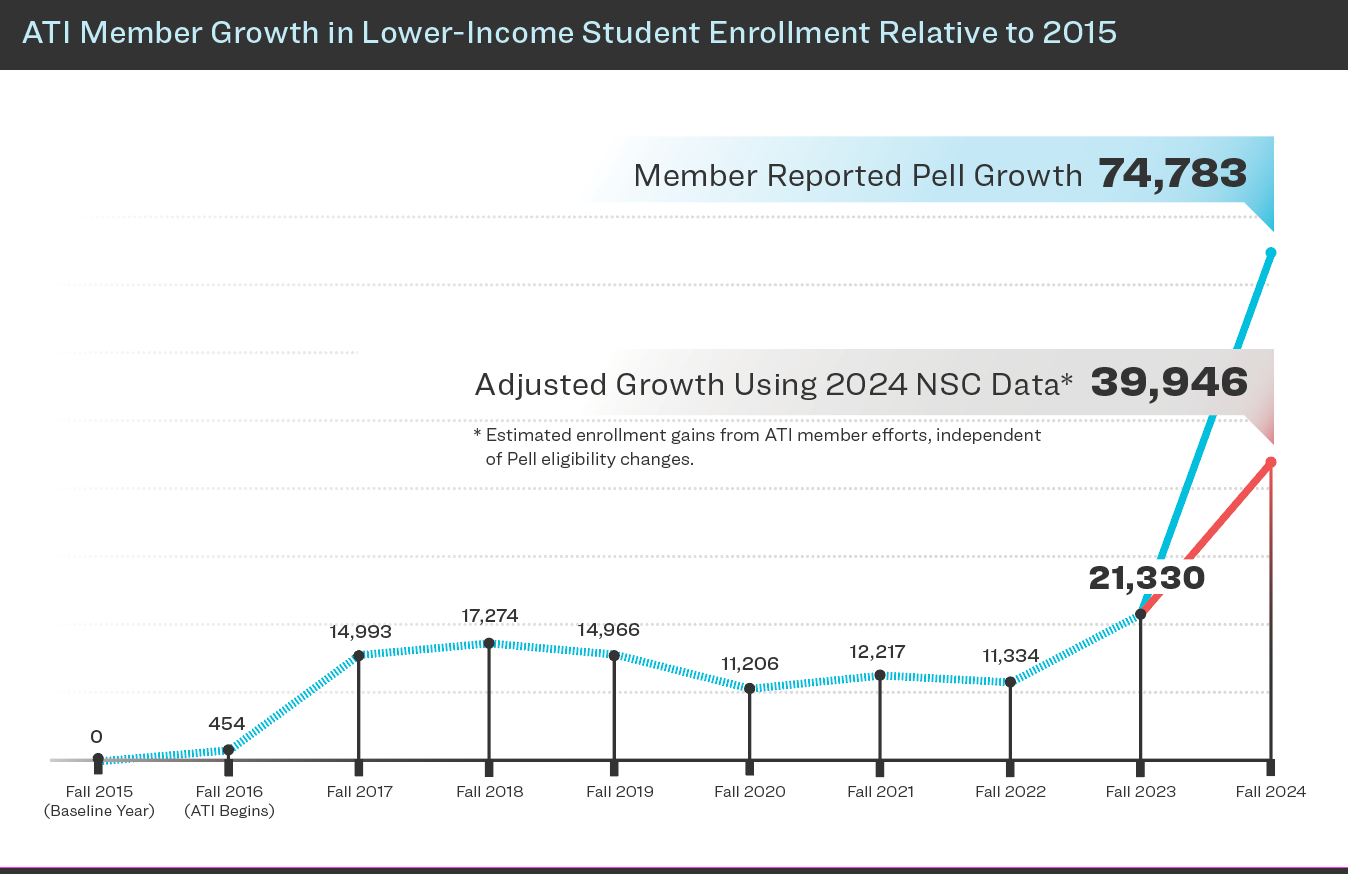
After the challenging pandemic years, 2023 proved to be a high water mark for ATI. Since our 2016 beginning, ATI colleges and universities have enrolled an additional 18,100 Pell students.
Additional Pell Students across ATI-eligible Members and Non-Members since 2015
The data shows that commitment matters: Even with the disruptions of the pandemic, ATI members have made more progress than ATI-eligible non-members. We are encouraged that two years after committing to specific institution-level goals for lower-income student enrollment and success, ATI members are showing evidence of a recovery from pandemic losses.
The data also demonstrate: (1) ATI’s limited ability to influence non-member institutions; and (2) the importance of sustained performance or progress at every ATI member institution. That’s why the five core strategies detailed in the 2023 annual report focus on individual member commitment and accountability, along with concrete practices that have demonstrated results.
ATI began elevating members’ progress toward their individual goals with the Accelerating Opportunity Campaign in the summer 2021.
By fall 2023, when the Accelerating Opportunity goals were in place enough time to expect to see an effect, we saw improvements, with 90 colleges and universities meeting or making progress toward their goals and 19 continuing to outperform their sector’s average Pell share. That left 28 members that had not yet made progress and three members that have yet to report data.
Altogether, 137 members added a cumulative 8,163 low-income students over the prior year. We are most encouraged by the recovery of members with high Pell shares, demonstrating their commitment to being engines of opportunity for those furthest from it.
ATI staff will continue to report on how members are progressing toward the Accelerating Opportunity lower-income enrollment goal they set (see the “Accelerating Opportunity” page of our website for more detail on these goals).
Our annual reports further detail the intiative’s outcomes. The latest 2023 report includes the five major strategies for the next stage of ATI’s work to increase opportunities for lower-income students at leading institutions. Those include specific aspirational enrollment goals for each member institution; a new “high-flier” program to recognize institutions making the greatest progress; strategizing ways to increase members’ investments in need-based financial aid; increasing enrollment of community college transfer students; and supporting institutions as they implement wrap-around services that promote student achievement and success.
Current and Prior Year Reports
Released in Spring 2024, ATI's fifth progress update is the first to report institutions' progress toward their individual Accelerating Opportunity goals.
Released in August 2022, ATI's fourth progress update includes details on the initiative's progress through Fall 2021 and relevant insights from the launch of ATI's Accelerating Opportunity campaign in Summer 2021.
Released in June 2021, ATI's third report provides an update on ATI's progress through Fall 2020 and describes plans to accelerate opportunity in response to both pre-COVID and COVID-era challenges.
Released in February 2020, ATI's second report highlights Pell growth amongst the ATI-eligible institutions through the 2018-19 school year, but points to initial signs of a leveling off of progress.
Released in December 2018, this first public report on ATI's progress shares notable Pell growth amongst ATI members between 2015-16 and 2017-18.

Who are ATI’s highest performers?
View the ATI members with the largest Pell enrollment growth, highest rate of Pell growth, and highest Pell enrollment shares:
Largest Growth: 2015-16 to 2022-23 | Highest Rate of Growth: 2015-16 to 2022-23 | Highest Pell Share 2022-23 | |||
---|---|---|---|---|---|
Baruch College | 1649 | Washington University in St. Louis | 116% | Baruch College | 63% |
University of Michigan-Ann Arbor | 1425 | Colby College | 79% | University of California-Merced | 59% |
University of Illinois at Urbana-Champaign | 1422 | University of Chicago | 73% | University of California-Riverside | 47% |
University of California-San Diego | 1235 | Claremont McKenna College | 65% | Stony Brook University | 40% |
Stony Brook University | 1222 | Stevens Institute of Technology | 59% | Spelman College | 38% |
University of Wisconsin-Madison | 1121 | Yale University | 58% | Towson University | 38% |
George Mason University | 1077 | University of Dayton | 52% | University of California-Irvine | 38% |
University of California-Merced | 1047 | Gettysburg College | 50% | Ripon College | 36% |
Boston University | 1004 | Johns Hopkins University | 49% | SUNY Oneonta | 33% |
The University of Texas at Austin | 868 | Centre College | 45% | Illinois Institute of Technology | 33% |
Members from across the initiative have made gains under even the most trying of circumstances. They show us progress is possible in a variety of contexts:
Between Fall 2015 and Fall 2022, Baruch College increased Pell enrollment by 1,649 students. As of Fall 2022, 63 percent of Baruch’s students received Pell grants.
Centre College has increased its Pell enrollment by 45% since Fall 2015, and continues to add additional Pell students amidst the pandemic.
Since reinstating transfer enrollment, Princeton has nearly tripled the amount of transfer students they have enrolled on campus. In Fall 2022, more than half of new transfers were Pell students.
As of Fall 2022, more than 38 percent of Spelman College students received Pell grants, the highest share among ATI private institutions.
Between Fall 2015 and Fall 2022, Stevens Institute of Technology increased Pell enrollment by 59%.
Between Fall 2015 and Fall 2022, Stony Brook University increased Pell enrollment by 1,222 students. In the last few years, Stony Brook’s 4-year Pell graduation rate increased from 57% (2012 entering cohort) to 67% (2018 entering cohort).
The University of California – Merced has a current Pell share of 59%. The University of California – Merced adding 1,047 Pell students 236 since Fall 2015.
Between Fall 2015 and Fall 2022, the University of Dayton increased the share of Pell students they enroll from 10 percent to 16 percent, with plans to add to those gains. Between Fall 2019 and Fall 2022, Dayton increased Pell enrollment by 199 students, even amidst the COVID-19 pandemic.
Between Fall 2015 and Fall 2022, the University of Wisconsin increased Pell enrollment by 1,121 students, with more than half of that growth occurring during the pandemic.
Between Fall 2015 and Fall 2022, Washington University in St. Louis more than doubled its Pell student enrollment.
Between Fall 2015-16 and 2022-23, Yale University increased Pell enrollment by 58%.